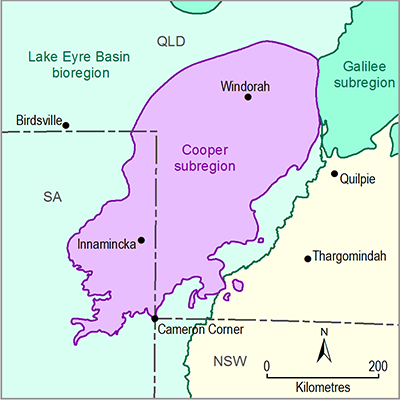
The Cooper subregion includes considerable ecological spatial variability as a consequence of its large area (130,000 km2) which includes important interactions between the following environmental factors:
- a variety of surface geological features and associated soil types, including low ranges and breakaways, cracking clay plains, gibber plains, desert dune fields and alluvial floodplains
- a gradient in amount and seasonality of rainfall from the north-east corner, where rainfall is somewhat summer-dominated, to the south-west corner, where rainfall is weakly winter-dominated
- the strong influences of surface water redistribution after rain, even in landscapes with modest degrees of topographic relief, and of access to near-surface groundwater, as is typical of Australian arid and semi-arid landscapes (e.g. Stafford Smith and Morton, 1990).
As an indication of the variability within the Cooper subregion, 14 IBRA subregions (Figure 34; SEWPac, Dataset 1; Bioregional Assessment Programme, Dataset 2) and 27 major vegetation subgroups defined in the NVIS v4.1 classification (Figure 34, Table 10; Australian Government Department of the Environment, Dataset 3) are represented. The north-eastern half of the subregion, where mean annual rainfall is in the range 300 to 600 mm, is dominated by Mitchell grass (Astrebla) tussock grasslands and Mulga open woodlands and sparse shrublands. The south-western half, where rainfall is less than 300 mm, is dominated by Hummock grasslands and saltbush and/or bluebush shrublands, including the sparse forms occurring on gibber plains.
Wetlands listed in DIWA (Department of the Environment, 2014c; Australian Government Department of the Environment, Dataset 9) occupy 12.8% of the area of the subregion and include representation of 21 NVIS v4.1 major vegetation subgroups (Table 10). The Coongie Lakes reserve in the western part of the subregion (Reid and Gillen, 1988; Butcher and Hale, 2011) constitutes a large proportion of the DIWA-listed area. At more than 2 million ha, the Coongie Lakes and their surroundings constitute Australia’s largest area designated as a wetland of international importance under the Ramsar Convention. A smaller Ramsar wetland, Lake Pinaroo, lies immediately south of the subregion, in NSW. Nationally mapped riverine floodplains that are also potentially water dependent, at least in part on a seasonal or multi-year basis through flooding and/or elevated watertable, occupy 12.2% and also include 21 of the vegetation subgroups found within the Cooper subregion (Table 10 and Figure 36). For both the DIWA wetlands and the riverine floodplains, the mapped areas include areas of vegetation subgroups that have low likelihood of being dependent on water in excess of local incident rainfall and sourced from subterranean and/or surface water flows (hereafter termed water dependent as per Methodology for bioregional assessments of the impacts of coal seam gas and coal mining development on water resources (BA methodology; Barrett et al., 2013)). The inclusion of non-water-dependent ecosystems in DIWA wetlands and riverine floodplains is due to the coarse resolution of existing map polygons which include some areas that are sufficiently distant from water bodies and/or sit well above ecologically accessible groundwater. The remaining 84.2% of the area is of terrestrial vegetation subgroups with limited likelihood of being water dependent.
Land use includes 12 of the 37 Australian Land Use and Management (ALUM) classification scheme secondary classes, but their occurrence is highly non-uniform (see Figure 9). Pastoral cattle grazing of native and semi-natural pasture, almost exclusively on leasehold lands (Figure 37), is by far the greatest land use (81.3% of the area), which is consistent with the predominance of semi-arid and arid climates, landscapes and vegetation community types. Conservation is the principal land use for 8.6% of the area, which is equal to the national average of 8.6% in the Australian National Reserve System (excluding lands of private and Indigenous landholders who have conservation amongst multiple land use objectives), above the Queensland average of 7.5% (Department of the Environment, 2012), and below the SA average of 13.7% (excluding regional reserves and Indigenous Protected Areas; 29.8% including these two categories) (Department of the Environment, 2012).
Figure 34 Interim Biogeographic Regionalisation for Australia subregions within the Cooper subregion
Data: SEWPaC (Dataset 1); Bioregional Assessment Programme (Dataset 2)
Figure 35 National Vegetation Information System major vegetation subgroups for the Cooper subregion
Data: Australian Government Department of the Environment (Dataset 3)
Table 10 National Vegetation Information System (v4.1) major vegetation subgroups in the Cooper subregion
Watercourses and floodplains from the combination of all other datasets listed as sources for Figure 36
Data: Bioregional Assessment Programme (Dataset 4); Queensland Herbarium, Environmental Protection Agency (Dataset 5); Australian Government Department of the Environment (Dataset 3); Geoscience Australia (Dataset 6, Dataset 7, Dataset 8); Australian Government Department of the Environment (Dataset 9, Dataset 10)
Table 11 Australian Land Use and Management Classification (version 7) land use classes in the Cooper subregion
Data: ABARE-BRS (Dataset 15)
Figure 37 Land tenure as at 2009 for the Cooper subregion
Data: Geoscience Australia (Dataset 11, Dataset 12, Dataset 13)


