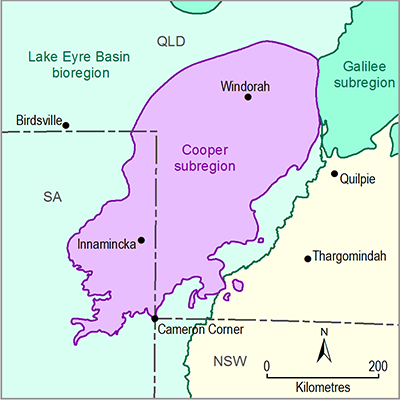
Groundwater quality data are sparse in the Cooper subregion. Data obtained from petroleum well tests drilled up until the late 1990s were compiled and summarised by Dubsky and McPhail (2001). Water samples were collected as part of drill stem tests (DST), production tests, liquid evaluation tests (LET), completion tests and other flow tests in exploration and development wells. As part of the data compilation some quality control processes were applied so as to minimise the inclusion of samples that were contaminated by drilling fluids.
Salinity data from Dubsky and McPhail (2001) are summarised in Table 7. The Eromanga Basin and Cooper Basin Nappamerri Group have salinities ranging from 811 to 8794 ppm sodium chloride equivalent; whereas groundwater in underlying Permian aged Cooper Basin sequences have salinities ranging from 1246 to 18,312 ppm sodium chloride equivalent. The report by Dubsky and McPhail (2001) includes salinity trend maps, which show that for most formations, salinity increases towards the interior of the Cooper subregion, as well as increasing with formation age. Groundwater quality data for the southern Cooper Basin indicates salinities ranging from around 2000 to 7000 mg/L total dissolved solids (TDS). Lower salinity groundwater is found in the Patchawarra Formation where it directly underlies the Hutton Sandstone, and may experience downward leakage from the GAB here (Hydrogeologic Pty Ltd, 2014).
Table 7 Formation water salinities by unit for the SA portion of the Cooper subregion
Source: Dubsky and McPhail (2001)
NA means ‘data not available’
Groundwater quality in Eromanga Basin aquifers has also been discussed by various authors including Cresswell et al. (2012), Love et al. (2013) and Radke et al. (2000). Some of the detail of their discussion is summarised below.
Solute concentration in groundwater for all Eromanga Basin aquifers increases down flow paths. This is interpreted as the result of mixing of dilute recharge water with more saline groundwater from the deeper parts of the basin, as well as water – rock interactions that can occur along groundwater flow paths (Cresswell et al., 2012; Love et al., 2013).
Differentiating water sources between the Lower Cretaceous-Jurassic aquifers and the Cretaceous aquifers (see Figure 23) can be done based on hydrogeochemical characteristics. The Lower Cretaceous-Jurassic aquifers are characterised by sodium-bicarbonate-chloride waters, whereas the Cretaceous aquifers are dominated by sodium-chloride water. The chemistry of the groundwater in the upper parts of the Cadna-owie – Hooray Aquifer and its equivalents (such as the upper Algebuckina Sandstone and Namur Sandstone) is influenced by downward diffusion from the marine mudstones of the Rolling Downs Group (Cresswell et al., 2012; Radke et al., 2000).
Groundwater obtained from aquifers in the older part of the Lower Cretaceous-Jurassic and Jurassic sequences is of better quality than that found in the Cretaceous aquifer. That is, water from the Namur and Adori sandstones is generally of better quality than the Cadna-owie Formation. Groundwater from all of the aquifers in the Lower Cretaceous-Jurassic sequence is of good quality and suitable for domestic, town water supply and stock use, though it is generally unsuitable for irrigation because in much of the Eromanga Basin it is characterised by high alkalinity and sodium content. Groundwater from the upper, Late Cretaceous, Winton and Mackunda formation aquifers in the Eromanga Basin in the subregion has higher salinity, but may be acceptable for stock water (Cresswell et al., 2012; Radke et al., 2000).
The Eyre Formation aquifer can be a useful aquifer for stock purposes. Water salinity is brackish to saline, ranging between 3000 and 12,000 mg/L TDS (SA Department for Water, 2011). Water quality in other Cenozoic and Quaternary aquifers is highly variable, from 1000 mg/L to greater than 100,000 mg/L TDS, and quantities are generally low. There is often a layer of fresh groundwater overlying more saline water. In the sandy dune country, good quality groundwater can be found at shallow depths in alluvial sediments adjacent to the major watercourses, such as Cooper Creek (SA Department for Water, 2011). Cenozoic aquifers in the Weena Trough have salinity ranging from 8500 to 21,000 mg/L TDS (Hydrogeologic Pty Ltd, 2014).

