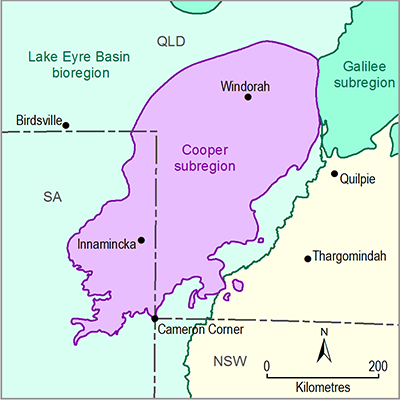
The Queensland Government operates a number of water quality measuring sites (including automated and manual sampling) under its nine Aquatic Ecosystem Provinces (AEPs) across the state (DERM, 2011b). The Cooper creek and Diamantina river basins are part of the Lake Eyre AEP. The frequency of sampling varies depending on operational conditions. These measurements generally include EC, temperature, pH, turbidity, nutrients, dissolved oxygen and total alkalinity (DNRM, 2012).
The availability of water quality data for the Cooper creek and Diamantina river basins is extremely poor due to logistic and accessibility difficulties associated with monitoring such a vast and sparsely populated area. There are six permanent monitoring sites for water quality data in the Cooper creek and Diamantina river basins of which only one (at Nappa Merrie) is located within the Cooper subregion. Among the sites, continuous auto-sensor data are available for Longreach station on the Thomson River. For the remaining stations, including the Nappa Merrie, no more than five sampled data points are available. In addition, there are 20 water quality monitoring sites (data loggers) in the Lake Eyre Basin including two in the Cooper subregion that have been operated by the Lake Eyre Basin Rivers Assessment (LEBRA) programme since 2011 (Cockayne et al., 2013). The LEBRA programme also operates occasional in situ measurements all across the sites.
As reported by DERM (2011b), EC levels are low and stable at each of the gauging stations but subject to occasional high pulses at some sites. At Longreach, the median EC is about 200 μS/cm at baseflow and 100 μS/cm at high flow, however, occasional high EC values occur anomalously at mid-flow ranges, particularly flows of between 0.1 and 10 m3/s (DERM, 2011b). Data from the LEBRA logger sites also showed a general pattern of increasing EC throughout the low or no flow periods, followed by sharp lowering during high-flow events. At some sites there is a distinct initial rise in EC when the first flood water arrives (Cockayne et al., 2013).
Turbidity is high and subject to varying trends as a result of local influences. It appears turbidity decreases from upstream to downstream and then increases again before the Cooper Creek crosses the Queensland–SA border. Due to the isolated water holes forming during the extended dry seasons in this basin, differing turbidity trends may be more representative of local influences than generally deteriorating water quality further downstream (DERM, 2011b). In situ measurements at 17 sites (during spring 2011 and autumn 2012) show the turbidity varies from 4 to 354 NTU, with a mean of 124 NTU across the Cooper creek basin (Cockayne et al., 2013).

