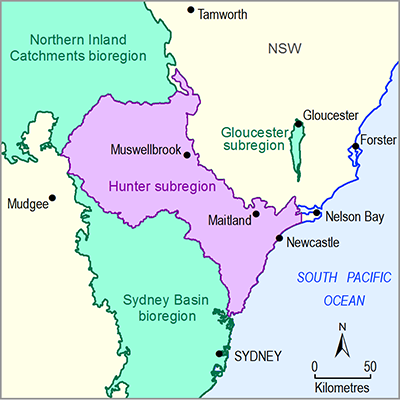
Trace element data as recorded by NSW Office of Water (Dataset 1) for the Hunter subregion have been summarised by aquifer type in Table 17 to Table 19, including the number of samples, range and number of samples that exceed the different use categories in the guidelines (human consumption, irrigation and stock watering). Classification of bores into alluvial, coastal sands and fractured rock aquifers was based on the method described in Section 1.5.1.2 . Data from the NSW Office of Water (Dataset 1) contains groundwater chemistry records from 1903 to 2013.
There are limited state agency data on trace elements in coastal sands aquifers (Table 18). Exceedances for the trace elements have been calculated using thresholds for human consumption from the ADWG (NHMRC and NRMMC, 2011) and for stock watering and irrigation water from the NWQMS (ANZECC/ARMCANZ, 2000). Trace element threshold values and number of bores exceeding the guidelines in the Hunter subregion groundwater bores are summarised in Table 17 to Table 19 . Over 40% of samples from Hunter subregion alluvial and fractured rock bores exceed drinking water guidelines for iron, lead, manganese and nickel, but is generally suitable for stock watering.
For the Hunter subregion, 7712 samples from 1278 bores were available, of which 847 (420 alluvial, 55 coastal sands and 372 fractured rock) bores (~66%) have one to two trace element measurements and 173 (109 alluvial and 64 fractured rock) bores (~14%) have more than ten trace element measurements.
It is difficult to provide meaningful interpretation of these trace element data, particularly for the purpose of assessing the impacts of coal resource developments on water quality, given the limited number of samples, lack of information about which water sources have been sampled and what the sources of the trace elements are.
Table 17 Number of analyses and exceedances for trace elements in alluvial aquifers of the Hunter subregion
aTable 3.4.1 in Australian Drinking Water Guidelines (NHMRC and NRMMC, 2011)
bTable 4.2.10 in National Water Quality Management Strategy (ANZECC/ARMCANZ, 2000)
cTable 4.3.2 in National Water Quality Management Strategy (ANZECC/ARMCANZ, 2000)
daesthetic water quality trigger (not health related)
NS = not specified
Data: NSW Office of Water (Dataset 1)
Table 18 Number of analyses and exceedances for trace elements in coastal sands aquifers of the Hunter subregion
aTable 3.4.1 in Australian Drinking Water Guidelines (NHMRC and NRMMC, 2011)
bTable 4.2.10 in National Water Quality Management Strategy (ANZECC/ARMCANZ, 2000)
cTable 4.3.2 in National Water Quality Management Strategy (ANZECC/ARMCANZ, 2000)
daesthetic water quality trigger (not health related)
NS = not specified
Data: NSW Office of Water (Dataset 1)
Table 19 Number of analyses and exceedances for trace elements in fractured rock aquifers of the Hunter subregion
aTable 3.4.1 in Australian Drinking Water Guidelines (NHMRC and NRMMC, 2011)
bTable 4.2.10 in National Water Quality Management Strategy (ANZECC/ARMCANZ, 2000)
cTable 4.3.2 in National Water Quality Management Strategy (ANZECC/ARMCANZ, 2000)
daesthetic water quality trigger (not health related)
NS = not specified
Data: NSW Office of Water (Dataset 1)

Product Finalisation date
- 1.5.1 Current water accounts
- 1.5.1.1 Surface water
- 1.5.1.1.1 Water storage in the Hunter river basin
- 1.5.1.1.2 Water storage in the Macquarie-Tuggerah lakes basin
- 1.5.1.1.3 Gauged inflows and outflows in the Hunter river basin
- 1.5.1.1.4 Gauged inflows in the Macquarie-Tuggerah lakes basin
- 1.5.1.1.5 Surface water entitlements and allocations
- 1.5.1.1.6 Water use in the Hunter Regulated River water source
- 1.5.1.1.7 Gaps
- References
- Datasets
- 1.5.1.2 Groundwater
- 1.5.1.1 Surface water
- 1.5.2 Water quality
- Citation
- Acknowledgements
- Contributors to the Technical Programme
- About this technical product
