Comprehensive water use data are not available for the Hunter subregion as a whole, but there is good information available for the Hunter Regulated River and Paterson Regulated River water sources and for the Hunter Water Corporation. Since most of the Paterson River water source is outside the subregion and water use is relatively low at about 2.4 GL/year on average between 2010–11 and 2014–15 (WaterNSW, 2011, 2012, 2013, 2014, 2015), the data presented here are for the more intensively used Hunter Regulated River water source. Hunter Water Corporation water sources are both within and outside the subregion, but most of the users of the water they supply are within the subregion. Between 2007–08 and 2014–15, HWC has diverted on average 67.8 GL/year to its customers (includes losses and use by HWC) (Hunter Water 2015a; 2011).
In NSW the majority of licensed extractions in regulated water sources and some highly committed groundwater systems are metered, following the introduction of requirements for metering in these water sources in the 1980s; in unregulated water sources, the level of metering has tended to be low. Following the National Water Initiative in 2004, all Australian governments agreed to new standards for water meters and meter data collection and a national framework for non-urban water metering. NSW has developed a policy for water extraction monitoring (NSW Department of Water and Energy, 2007) that sets out the objectives for meeting the new standard, including having 90% of water extracted in each WSP area subject to active monitoring. NSW’s Water Act 1912 now requires a licensee to purchase, install and maintain a water meter or other monitoring equipment (e.g. electricity consumption meter; pump revolution meter; pump operating hours monitor) on extractions for commercial purposes – under NSW’s Water Management Act 2000, this responsibility resides with the water supply works approval holder. WaterNSW (formerly the State Water Corporation) has the responsibility for monitoring water extraction in the regulated system, while DPI Water is responsible for monitoring in the unregulated and groundwater systems.
Figure 7 summarises actual surface water use (GL) for the Hunter Regulated River water source between 2010–2011 and 2013–14. On average over these four years, 117 GL was extracted from this water source per year, representing 54% of the long-term average diversion limit (217 GL, Table 8) – this average does not include dilution flows (in 2011–12, there were almost 62 GL of water released for dilution purposes). Take varied from 115 to 124 GL, always well below the volume of licensed entitlements for the water source.
Data on take from the unregulated water sources of the Hunter river basin are not available, but can be inferred, in part, from patterns of take from the Hunter Regulated River water source.
In the Hunter Regulated River water source, most surface water is taken under general security, major utility and supplementary water licences, consistent with their share of the water entitlement pool. However, there can be considerable variation in take from year to year. Supplementary take varied from 16 GL in 2013–14 to 57 GL in 2011–12, whereas general security take exhibited the opposite pattern with the highest volume of take (55 GL) in 2013–14 and the lowest volume of take (14 GL) in 2011–12. Supplementary take in 2011–12 was in excess of the licensed entitlement volume of 49 GL/year (Table 9) due to a very high allocation (190%) of supplementary water take (Figure 5). Use by major utilities appears to be less variable, ranging from 24 to 32 GL over the four-year period. This is likely due to less sensitivity to changes in climate and a more constant demand for the power generation sector. Water supply to Newcastle, primarily from Chichester and Grahamstown water storages, over this period ranged from about 63 to 71 GL (Hunter Water, 2015b) or 26 to 29% of Williams River water source licensed entitlements (247 GL, Table 8).
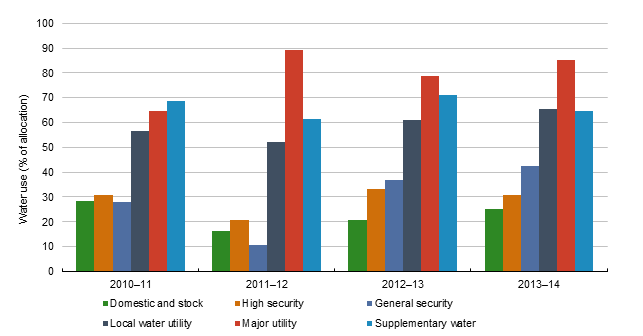
Figure 8 summarises surface water use as a percentage of water allocation (i.e. actual water take divided by water allocation volume) for the Hunter Regulated River water source for the same four‑year period. Major water utilities averaged close to 80% of allocations, with a range of 64 to 89%. Opportunistic take of water under supplementary licences varied between about 60 and 70% of allocation. Take under general security licences was more variable, varying between 10 and 43% of allocation over the four years, with a mean close to 30%. This variability is typical for general security licences, which tend to be held for agicultural uses. Crop water requirements vary considerably with climate, with extractions tending to be low when there is sufficient rainfall to meet crop water demands and higher during dry periods.
In absolute terms, extractions from the Hunter Regulated River water source under domestic and stock, local water utility and high security licences are small by comparison to other licence types (Figure 7). This is consistent with these licence types comprising about 14% of the licensed entitlement volume. However, Figure 8 shows that over the four years, take by local water utilities was relatively high at between 52 and 66% of allocation. Extractions under high security licences and for domestic and stock use tend to be well below licensed allocations during this period. High security licensed use varied between 21 and 32% of entitlements, but this proportion would be expected to be considerably higher during extended dry periods, when allocations of general security water are reduced.
Water take by the mining sector between 2010–11 and 2013–14 ranged from 5.6 GL (12% of entitlement) to 15.6 GL (33% of entitlement) across high, general and supplementary licences. As a proportion of total take by all users in the Hunter Regulated River water source, this represents 4.8 to 13.3% of take. In 2005–06, mine water take exceeded 18 GL (38% of entitlement) and was as low as 4.5 GL (10% of entitlement) in 2007–08 (NSW Department of Primary Industries, 2014).
The four years of use data available suggest that the levels of extraction from this key water source are generally below the licensed entitlements. Use by the mining sector is relatively small, but based on entitlements held, the mining industry is able to extract more water than they are currently using. Water theft may occur, but the volume of water extracted without a licence for uses other than stock and domestic are not known.

Figure 7 Water use (GL) by surface water licence type for the Hunter Regulated River water source
Number above each year is the total water use for each year.
Data: WaterNSW (Dataset 12)
Data: WaterNSW (Dataset 12)
