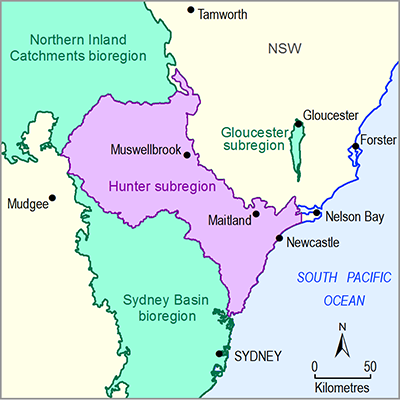
Groundwater chemistry data were compiled from the NSW water quality database (NSW Office of Water, Dataset 1). For the Hunter subregion, 7712 samples from 1278 bores were available, of which 7273 samples (94%) included salinity (electrical conductivity) measurements, but only a small number of samples included trace element measurements. This NSW groundwater database contains data from bores drilled in the early 1900s through to the present day. This is likely to mean that over the period of record, measurements have been made using different sample collection methodologies and analysis methods with implications for the consistency of data quality through time. Analysis of the salinity data revealed values that exceed the physical limits for salinities expressed in microsiemens per centimetre (μS/cm), suggesting that the dataset contains records using a mix of units. Since these extreme values all occurred prior to 1985, only samples collected after 1985 are summarised here. It is possible that there are still spurious records within the subsample used (i.e. values that are physically possible, but unusually low (e.g. 21) which could be in dS/m; or unusually high (e.g. 48,600) which could be in μS/m), and the assessment of water quality should be viewed as indicative. Where multiple records were available for individual bores, the data have been averaged. Groundwater salinities tend not to be as variable as streamflow salinities over time, so averages provide a useful indication of water quality.
None of the bores in Dataset 1 (NSW Office of Water, Dataset 1) are attributed to specific hydrogeological units. To summarise the groundwater chemistry data by aquifer type, each bore was assigned to a hydrogeological unit using the approach described in Section 1.5.1.2 . The approach has limitations and some bores may be incorrectly assigned as a result. Location and drilled depth of bore were obtained from the NSW groundwater bore database collected for inclusion into the National Groundwater Information System (NGIS) (NSW Office of Water, Dataset 2).
To assist in the interpretation of water quality, the groundwater chemistry data have been classified according to suitability for a range of potential uses: human consumption, stock consumption and long-term irrigation (defined as up to 100 years). Threshold values were obtained from the Australian Drinking Water Guidelines (ADWG) (NHMRC and NRMMC, 2011) and the National Water Quality Management Strategy (NWQMS) (ANZECC/ARMCANZ, 2000).
Water quality data are often collected by mining companies as part of environmental assessment and monitoring requirements to obtain and meet conditions of a mining licence. This information was not sought nor obtained as part of the project.

Product Finalisation date
- 1.5.1 Current water accounts
- 1.5.1.1 Surface water
- 1.5.1.1.1 Water storage in the Hunter river basin
- 1.5.1.1.2 Water storage in the Macquarie-Tuggerah lakes basin
- 1.5.1.1.3 Gauged inflows and outflows in the Hunter river basin
- 1.5.1.1.4 Gauged inflows in the Macquarie-Tuggerah lakes basin
- 1.5.1.1.5 Surface water entitlements and allocations
- 1.5.1.1.6 Water use in the Hunter Regulated River water source
- 1.5.1.1.7 Gaps
- References
- Datasets
- 1.5.1.2 Groundwater
- 1.5.1.1 Surface water
- 1.5.2 Water quality
- Citation
- Acknowledgements
- Contributors to the Technical Programme
- About this technical product
