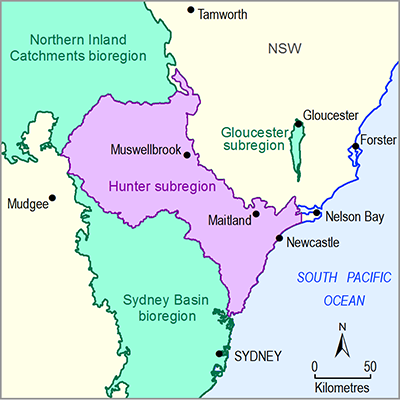
As previously stated, DPI Water undertakes monthly monitoring of temperature, DO, EC, pH, turbidity, TN and TP at nine gauging stations within the Hunter river basin.
The Bureau of Meteorology is mandated to collect water information from organisations across Australia, which are named in the Water Regulations 2008, with a view to establishing a national water information system. Water quality data is one of the categories of data the Bureau of Meteorology collects. The Bureau of Meteorology surveyed water data collection agencies around Australia to establish what water information agencies collect or have historically collected and could provide to it. Results of the survey indicated that a range of water quality data are or have been collected in the Hunter subregion, although not all of the data have been supplied to the Bureau of Meteorology (Table 15) (C Price (Bureau of Meteorology), 2015, pers. comm.).
Table 15 shows that there are a number of sources of information about surface water quality in the Hunter subregion. Some of these measurements would be to monitor water quality for drinking water and safe swimming conditions (e.g. Gosford City Council). Other water quality parameters, such as TP, TN, total suspended solids (TSS) and temperature, are collected to ensure safe levels for aquatic habitat. The types of data collected provide some indication of the water quality concerns in the subregion. Except for EC, the water quality parameters collected do not specifically reflect issues arising from mining development.
Table 15 Surface water quality parameters collected by water data organisations for the Hunter subregion
|
Agency |
Water quality variables |
Details |
|---|---|---|
|
DPI Water |
EC, temperature, pH |
Ongoing, continuous monitoring (Bioregional Assessment Programme, Dataset 1) |
|
DO, turbidity, TN and TP |
Since 2007, monthly readings at 9 gauging stations in the Hunter Data not supplied to the Bureau of Meteorology |
|
|
NSW Office of Environment and Heritage |
EC, temperature, pH, TP, Turbidity |
Historic (1994–2006): 130 samples in Hunter subregion across 52 sites across ~60 dates (NSW Office of Environment and Heritage, Dataset 7) |
|
WaterNSW (formerly State Water Corporation) |
EC, temperature |
Send their data to NSW DPI Water (might be part of Bioregional Assessment Programme, Dataset 1) |
|
Hunter Water Corporation |
EC, temperature, pH, TSS, TP, TN, |
Not sent to Bureau of Meteorology |
|
Hunter Local Land Services (formerly Hunter-Central Rivers Catchment Management Authority) |
EC, TDS |
Black Creek and Glendon Brook (2007–2009) Discrete Non-ongoing (Hunter Local Land Services, Dataset 8) |
|
Gosford City Council |
EC, temperature, pH, TSS, TP, TN, Turbidity, DO, OP, TKN, NOx, Ammonia N, BOD, Chlorophyll a, Enterococci, Coliforms |
Lab analyses reports (PDF) (2008–2009) Discrete (Gosford City Council, Dataset 9) |
|
Wyong Shire Council |
EC, temperature, pH, TSS, TP, TN Turbidity |
Weekly (discrete) (2008–2014) for Ourimbah Creek and Wyong River water pump stations (Wyong Shire Council, Dataset 10) |
EC = electrical conductivity; TSS = total suspended solids; TP = total phosphorus; TN = total nitrogen; TDS = total dissolved solids; DO = dissolved oxygen; OP = ortho-phosphorus; TKN = total Kjeldahl nitrogen; NOx = nitrogen oxides
Water quality data are often collected by mining companies, as part of environmental assessment and monitoring requirements to obtain and meet conditions of a mining licence. This information was not sought or obtained as part of the Assessment. Water quality data are often collected by local councils, universities, local land services and other organisations, particularly where water is being used for drinking water supply or for recreational purposes and particular standards are required to be maintained. A search for these data was also not undertaken. Project-specific water quality data can be very difficult to interpret, due to issues of sampling frequency, length of monitoring, lack of accompanying flow data and lack of information about the objectives of sampling. The data can take a lot of time to sift through and understand and will often not be sufficient to build a regional view of water quality.

Product Finalisation date
- 1.5.1 Current water accounts
- 1.5.1.1 Surface water
- 1.5.1.1.1 Water storage in the Hunter river basin
- 1.5.1.1.2 Water storage in the Macquarie-Tuggerah lakes basin
- 1.5.1.1.3 Gauged inflows and outflows in the Hunter river basin
- 1.5.1.1.4 Gauged inflows in the Macquarie-Tuggerah lakes basin
- 1.5.1.1.5 Surface water entitlements and allocations
- 1.5.1.1.6 Water use in the Hunter Regulated River water source
- 1.5.1.1.7 Gaps
- References
- Datasets
- 1.5.1.2 Groundwater
- 1.5.1.1 Surface water
- 1.5.2 Water quality
- Citation
- Acknowledgements
- Contributors to the Technical Programme
- About this technical product
