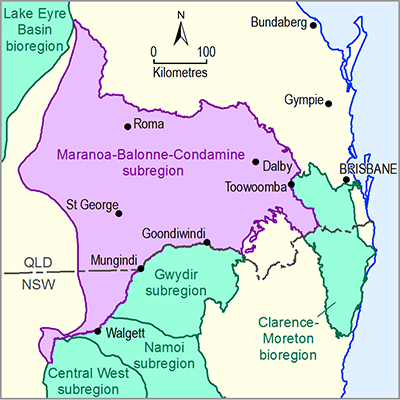
1.1.5.3.1 Condamine-Balonne river basin
The Condamine-Balonne river basin contributes about 8.5% of the total runoff and uses 3% of the surface water diverted for irrigation in the Murray–Darling Basin (CSIRO, 2008a). The mean annual rainfall for the Condamine-Balonne river basin is 514 mm, ranging from 1200 mm in the east to 400 mm in the west (NWC, 2013). Most of the rainfall occurs during the summer months of October to March and runoff is highest in summer and early autumn.
The long-term (1895 to 2006) mean annual modelled runoff over the entire Condamine-Balonne river basin is 19 mm (runoff ratio = 3.7%). However, the runoff for a recent ten-year period (1997 to 2006) was 23% lower than the long-term mean. Given the inter-annual variability, this difference is statistically insignificant (CSIRO, 2008a). Droughts and floods are common in the basin (NWC, 2013).
Forty-two stream gauging stations are still operational in the Condamine-Balonne river basin within the Maranoa-Balonne-Condamine subregion (Table 12). These stations are managed by the Queensland Department of Natural Resources and Mines and have record lengths ranging from a few years to more than 90 years (on the Balonne River at St George). There are several others with more than 40 years of recorded data, including the Condamine River at Chinchilla (58 years) and the Balonne River at Weribone (44 years). The eastern half of the Condamine-Balonne river basin has more gauged catchments than the western half, which has no small- or medium-sized gauged catchments. This would have implications for rainfall-runoff modelling at smaller scales in the western half of the river basin. The Queensland Government provides summary statistics from streamflow gauging stations in the Condamine-Balonne river basin in Queensland Government (2013).
The impact of climate change by the South Eastern Australian Climate Initiative (SEACI) for Condamine-Balonne river basin indicated that 11 of 15 global climate models (GCMs) projected a decrease in future rainfall showing a median reduction of 13% and 21% in future runoff under 1 and 2 degree global warming, respectively (Post et al., 2012). See Section 1.1.2.3‘Climate’ for further details. An earlier modelling using climate change projections for 2030 conditions based on input from nine of 15 GCMs also indicated a decrease in future runoff in Condamine-Balonne river basin (CSIRO, 2008a).
Table 12 List of open stream gauging stations within the Condamine-Balonne river basin. Some of the stations are re-sited and have a longer record length than listed here
Source data: Queensland Government (2013)
1.1.5.3.2 Moonie river basin
The Moonie river basin has a summer-dominated rainfall with an annual mean of 528 mm ranging from 700 mm in the east to 450 mm in the west. The mean annual rainfall has remained relatively consistent over the last 100 years. The Moonie river basin contributes less than 1% of the total runoff in the Murray–Darling Basin. The long-term (1895 to 2006) modelled mean annual runoff is 17 mm and the mean annual runoff ratio is 3.2% (CSIRO, 2008b).
There are three stream gauging stations in the Moonie river basin, all on the Moonie River. Two of the gauging stations have more than 40 years of flow records (Table 13). The mean observed monthly flows downstream from Flinton (417205A), Nindigully (417201B) and Fenton (417204A) are 13.2, 11.8 and 14 GL respectively, indicating a loss of flow in the middle reaches.
Table 13 List of open stream gauging stations within the Moonie river basin. Some of the stations are re-sited and have a longer record length than listed here
Source data: Queensland Government (2013)
The impact of climate change by the South Eastern Australian Climate Initiative (SEACI) for Moonie river basin indicated that 11 of 15 GCMs projected a decrease in future rainfall showing a median reduction of 12% and 20% in future runoff under 1 and 2 degree global warming, respectively (Post et al., 2012). See Section 1.1.2.3 ‘Climate’ for further details. An earlier modelling using climate change projections for 2030 conditions based on input from nine 15 GCMs also indicated a decrease in future runoff in the Moonie river basin (CSIRO, 2008b).
1.1.5.3.3 Border Rivers river basin
The subregion within Border Rivers river basin has a summer-dominated rainfall and ranges from 800 to 500 mm from east to west (see Section 1.1.2.3). The modelled mean annual runoff is 32 mm over the entire basin generating 4.7% of the total runoff of the Murray–Darling Basin (CSIRO, 2007).
There are 19 stream gauging stations in the Border Rivers river basin within the Maranoa-Balonne-Condamine subregion. They are managed by the Queensland Department of Natural Resources and Mines (Table 14). The lengths of flow records vary from a few years to 96 years (for Macintyre River at Goondiwindi). The mean annual runoff for Callandoon Creek at Carana Weir is noted to be unusually high (3863 mm), which might be due to either an error in the estimated catchment area or in the measurement of flow volume.
The impact of climate change by the South Eastern Australian Climate Initiative (SEACI) for whole of Border Rivers river basin (including areas that are outside the subregion) indicated that 11 of 15 GCMs projected a decrease in future runoff showing a median reduction of 14% and 25% under 1 and 2 degree global warming, respectively (Post et al., 2012). See Section 1.1.2.3‘Climate’ for further details. The CSIRO (2007) study also indicated the effect of projected climate change on future runoff in the whole of the Border Rivers river basin is a likely decrease of runoff of about 9% for 2030 climate based on a median estimate. Surface water – groundwater exchange under the median 2030 climate is projected to be unaffected.
Table 14 List of open stream gauging stations in the Border Rivers river basin within the Maranoa-Balonne-Condamine subregion. Some of the stations are re-sited and have a longer record length than listed here

