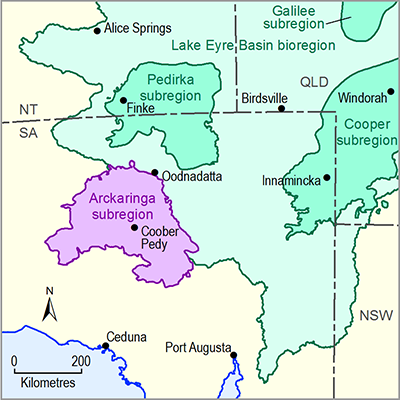
As previously mentioned, there are no consistent discharge data available for the Arckaringa subregion. Opportunistic flow measurements at Algebuckina Waterhole, situated 2km downstream of the subregion boundary (Figure 31), during field trips have been collected during periods of flow recession and, in November 2000, a moderate flow event was observed. This flood was sub-bankfull but utilised several channels in the anastomosing channel reach upstream of the waterhole. This enabled the development of a partial rating curve that was used in converting daily water level data into daily discharge estimates for the period April 2000 – February 2002 (Costelloe et al., 2005a). However, in that case the rating curve was deemed unreliable above the maximum gauged level (9000 ML/day) as larger flows also enter another channel that bypasses Algebuckina Waterhole. As water level data are a function of channel morphology, this rating curve cannot be applied to other waterholes for the same time period, or indeed to stage data for Algebuckina Waterhole itself at a different time, owing to the inherent variability of CTFD in this subregion.
Although there are no volumetric flow data collected in the Arckaringa subregion, stage data of varying quality and length have been collected for all waterholes over the period 2000 to 2013 for the Neales-Peake catchment. Owing to malfunctioning loggers, disturbance from local fauna, theft and varying installation and removal dates, there is little consistency in the data collected across waterholes and no single waterhole has continuous data for that period (JF Costelloe, pers. comm., 2013). However, the data collected is invaluable (due to a paucity of other available data) and is currently being used to inform hydrologic modelling that is being undertaken for the region.
The stage data for Algebuckina Waterhole represent the most complete set of water level data in or near the region, and are shown in Figure 32. The data shown represent a merging of data collected through multiple loggers installed through the ARIDFLOW project (Costelloe et al., 2004), the Critical Refugia Project (Costelloe, 2011a) and a telemetered gauge installed by the South Australian Department of Environment, Water and Natural Resources in 2011, with post-processing necessary to ensure consistency throughout the period of record (JF Costelloe, pers. comm., 2013).
The stage record shown in Figure 32 indicates not only the major floods described in Section 1.1.5.1.1, but also local flows. The period 2010 to 2011 is particularly interesting as it demonstrates multiple small flow events of that notably wet year.
Figure 32 Stage at Algebuckina Waterhole from March 2000 - March 2013

Product Finalisation date
- 1.1.1 Bioregion
- 1.1.2 Geography
- 1.1.3 Geology
- 1.1.4 Hydrogeology and groundwater quality
- 1.1.5 Surface water hydrology and surface water quality
- 1.1.6 Surface water – groundwater interactions
- 1.1.7 Ecology
- Citation
- Acknowledgements
- Contributors from the Government of South Australia
- Contributors to the Technical Programme
- About this technical product

