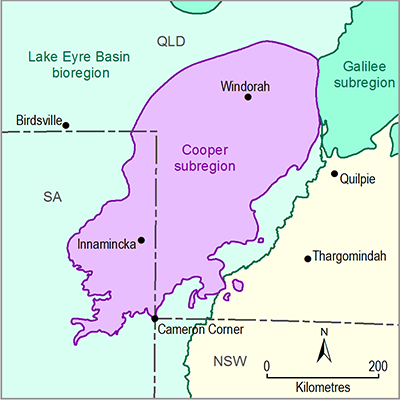
This section identifies information sources for assessing groundwater quality for the Cooper subregion. It is built on the information provided in companion product 1.1 for the Cooper subregion (Smith et al., 2015). This section also presents groundwater quality data in the area of the Southern Cooper Basin Gas Project. Groundwater chemistry data and information for the Cooper subregion are available from the Queensland groundwater bore database (DNRM, 2015), SA WaterConnect (Government of South Australia, 2014), Cresswell and Duesterberg (2012), Dubsky and McPhail (2001), Radke et al. (2000), Love et al. (2013), and prescribed wells area status reports (SA Department for Water, 2011; DEWNR, 2012, 2013), with some supplementary information available from well completion reports (Geological Survey of Queensland, 2013; DSD, 2015) and environmental approval application documents (Golder Associates, 2013; Hydrogeologic Pty Ltd, 2014; JBS&G Australia Pty Ltd and Strike Energy Limited, 2014). Further information is provided in the Geoscience Australia Great Artesian Basin Hydrogeological Atlas (version 1.0) (e.g. Geoscience Australia (Dataset 1), Geoscience Australia (Dataset 2)).
1.5.2.2.1 Total dissolved solids
This section describes total dissolved solids in the southern Cooper Basin.
Groundwater salinity in the geological Lake Eyre Basin aquifers (most likely the Cenozoic Eyre Formation) ranges from 8500 mg/L to 21,000 mg/L total dissolved solids (TDS), with a pH between 7.0 and 8.0 (Hydrogeologic Pty Ltd, 2014).
TDS for the Cadna-owie – Hooray Aquifer (and equivalents) is shown for illustrative purposes in Figure 7. This shows that within this Great Artesian Basin (GAB) aquifer, TDS increases along flow paths, from the north-west to the south-east. Figure 8 shows TDS for the Hutton (basal GAB) Aquifer in the Cooper subregion. This map shows higher TDS associated with the deeper parts of the GAB.
TDS in the GAB aquifers within 100 km of the Southern Cooper Basin Gas Project varies. At Montecollina Bore, which taps groundwater from the Cadna-owie Formation, TDS is 5500 to 7100 mg/L. In contrast other bores in the southern Cooper Basin have TDS of 1000 to 1800 mg/L, although bores completed in the Jurassic Bulldog Shale recorded TDS values up to 12,000 mg/L (Hydrogeologic Pty Ltd, 2014).
Groundwater quality data for the deeper and older Permian units of the southern Cooper Basin are of limited extent and number. Hydrogeologic Pty Ltd (2014) identify a range in TDS of approximately 2000 to 7000 mg/L. The upper limits of this range may be the result of hydraulic stimulation fluid influencing analyses. The lower part of this range is defined by analyses from bores in the Patchawarra Formation, where it is in direct contact with, and potentially affected, by downward leakage from the Hutton Sandstone (Dubsky and McPhail, 2001; Hydrogeologic Pty Ltd, 2014).
Data: Geoscience Australia (Dataset 1)
Data: Geoscience Australia (Dataset 2)
1.5.2.2.2 Trace elements
Groundwater quality from the Eromanga Basin and Cenozoic aquifers (referred to as the Tertiary Sediments and Glendower Formation) is summarised in Golder Associates (2013). They collated 494 samples from an area which encompasses the Queensland portion of the Cooper subregion. Golder Associates (2013) found that the younger Eromanga Basin aquifers and Cenozoic aquifers have similar water quality characteristics (with higher sodium and magnesium), whereas deeper units of the Eromanga Basin have different hydrochemical characteristics (Figure 9).
Source: After figure 26 and 27 from Golder Associates (2013). This figure is not covered by a Creative Commons Attribution Licence. © Santos Ltd
Data shown are limited to the western Queensland portion of the subregion.
This figure has been optimised for printing on A3 paper (297 mm x 420 mm).
Groundwater hydrochemistry for the southern Cooper Basin area is also summarised by Hydrogeologic Pty Ltd (2014), although this is based on a much more limited dataset. The Piper diagram (Figure 10) shows that, in general, the Cenozoic aquifers can be distinguished from the aquifers of the Cooper Basin and GAB aquifers. The Cenozoic aquifers have groundwater of sodium-chloride water type, whereas the Cooper Basin and GAB aquifers have sodium-chloride–carbonate and bicarbonate water types.
Source: After Appendix A of Hydrogeologic Pty Ltd (2014) © Strike Energy
Golder Associates (2013) also provided a comparison of groundwater quality to various regulatory guidelines. This includes a comparison of groundwater quality against the Australian Drinking Water Guidelines (ADWG) (National Health and Medical Research Council and Natural Resource Management Ministerial Council, 2004) (Table 5).
Golder Associates (2013) characterised groundwater quality in relation to total hardness, livestock watering suitability (ANZECC/ARMCANZ, 2000), and agricultural use. They found that approximately 48.9% of samples represented soft groundwater, 16.3% moderately hard, 19.4% hard and 15.5% very hard. Livestock watering suitability is based on TDS concentrations and some specific ions, in a similar fashion to the ADWG. Groundwater generally has TDS concentrations less than 3000 mg/L, and is suitable for watering most livestock. Agricultural suitability was assessed based on a combination of sodium hazard and salinity hazard, using a Wilcox Plot. Groundwater in the Golder Associates (2013) study area has a range of hazard classifications and is mostly unsuitable for irrigation.
Table 5 Comparison of groundwater quality from the Cooper subregion with Australian Drinking Water Guidelines
Data: After Table 16 from Golder Associates (2013)
aHealth value
bAesthetic value
cTDS concentrations complying with standard
dHealth threshold is 5 mg/L, less than 0.05 mg/L desirable
eADWG threshold 50 for Nitrate (reported as nitrate), which equates to 11.29 as Nitrate-N
1.5.2.2.3 Gaps
The main data gap identified is the scant groundwater quality for all hydrostratigraphic units throughout the subregion. More detail on groundwater quality would enable a robust baseline to be established. Such data could be held in company databases, and not yet publicly available. For example, a comprehensive dataset of hydrochemical data on Lake Blanche and other GAB springs is referred to in Hydrogeologic Pty Ltd (2014), these data are held by BHP Billiton and are not publicly available.


