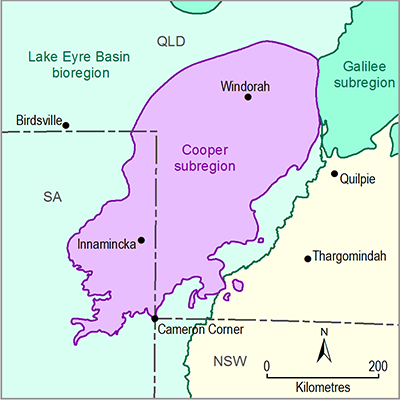
There are three main sources of surface water quality data for the Cooper subregion. This includes the SWAN monitoring programme operated by the Queensland Government (DERM, 2011), Aquatic Ecosystem Condition Reports of the SA Government (EPA, 2015) and information collected under the LEBRA programme (Cockayne et al., 2013; Sternberg et al., 2014). The SWAN monitoring programme has been in operation since 1990 and monitors water quality parameters at selected stream gauge sites using auto-sensor recorders. The LEBRA programme commenced in 2011 and collects water quality data using data loggers and occasional in situ sampling. Water quality indicators included in this report are EC, TN, TP and turbidity, and are based on SWAN’s 2004 to 2008, EPA’s 1972 to 2012 and LEBRA’s 2011 to 2013 data.
Current status of water quality in the Cooper subregion has been assessed against the Queensland Water Quality Guidelines (QWQGs) (DEHP, 2009). The QWQGs were derived from the Australian and New Zealand Environment and Conservation Council (ANZECC) guideline values or descriptive statements for environmental values to protect aquatic ecosystems and human uses of water (ANZECC, 2000). The QWQGs are intended to address the need identified in the ANZECC guidelines by providing guideline values that are specific to Queensland (DEHP, 2009).
1.5.2.1.1 Water quality in the Cooper creek basin
The availability of water quality data for the Cooper creek basin is relatively limited. There are five Queensland Government operated water quality monitoring sites (Blackall and Retreat on Barcoo River, Bowen Downs on Cornish Creek, Longreach on Thomson River and Nappa Merrie on Cooper Creek) in the Queensland part of Cooper creek basin. There are two water quality monitoring sites (Cullyamurra and at North West Branch of Cooper Creek) in the SA part of the Cooper subregion operated by the SA Government. Among the sites, continuous auto-sensor records of EC are available for Longreach station (since 1993). In addition there are eight LEBRA operated automatic monitoring sites in the Cooper creek basin (one in the subregion) that have operated since 2011. The LEBRA programme also collects in situ measurements every year at its 50 sites within the Lake Eyre Basin, of which 17 are in the Cooper creek basin (Sternberg et al., 2014).
The EC values in the Cooper creek basin are generally lower than the water quality objective trigger value. The 75th percentile baseflow trigger value for EC is 200 μS/cm for the Lake Eyre region (DEHP, 2009). A typical example of auto-sensor data at Longreach gauging site is shown in Figure 6 for 2005 to 2013. Gaps in the measured EC auto-sensor dataset represent periods where data were not collected due to periods of no-flow or monitoring equipment failure. EC varies between 44 to 258 µS/cm with a mean of 155 µS/cm. The median EC for baseflow is about 200 µS/cm and for high flow it is 100 µS/cm with an overall median of 157 µS/cm. However, occasional high EC values occur anomalously at mid-flow ranges, particularly between flow rates of 0.1 and 10 m3/s (DERM, 2011). These may be the result of the ‘first flush’ of a flow event after a dry period, where accumulated salts are cleared from the intermittently flowing watercourse. In general, EC levels are low and stable at each of the gauging stations but subject to occasional high pulses at some sites. Data from the LEBRA logger sites also showed a general pattern of increasing EC throughout the low or no-flow periods, followed by sharp decrease during high-flow events. At some sites there is a distinct initial rise in EC when the first flood water arrives (Cockayne et al., 2013). The EC varies greatly spatially and temporally and reaches its maximum value during the no-flow phase (Sheldon and Fellows, 2010).
Turbidity in the Cooper creek basin is generally high and subject to varying trends across the basin as a result of local influences. It appears to reverse from a declining trend in the north of Cooper Creek to an increasing trend before crossing the Queensland–SA border (DERM, 2011). Due to the tendency towards formation of isolated waterholes during the extended dry seasons in this basin, differing turbidity trends may be more representative of local influences than generally deteriorating water quality further downstream (DERM, 2011). In situ measurements at 17 sites (during spring 2011 and autumn 2012) show the turbidity varies from 4 to 354 NTU (Nephelometric Turbidity Unit), with a mean of 124 NTU across the Cooper creek basin (Cockayne et al., 2013). Turbidity reaches its maximum value during the flood (Sheldon and Fellows, 2010).
The availability of TN and TP data for the Queensland part of the Cooper subregion is very low (less than five data points) to draw any conclusion on nutrients (DERM, 2011). Sampled discrete water quality data (e.g. EC, TN, TP and turbidity) for the Cullyamurra waterhole (GS003501) in the SA part of the Cooper subregion are available since 1972 (EPA, 2015). An analysis based on 120 discrete data sampled between 1972 and 2007 shows that TN varies from 0.72 to 4.75 mg/L with a mean of 1.5 mg/L and TP varies 0.14 to 0.59 mg/L with a mean of 0.38 mg/L.
Data: Queensland Department of Natural Resources and Mines (Dataset 1)
1.5.2.1.2 Gaps
The spatial and temporal distribution of water quality data for the surface water systems of the Cooper subregion is limited. Thus, it is difficult to draw conclusions about water quality based on currently available data.


