Annual flow
Figure 13 shows the hydrological changes to the annual flow (AF) at 61 model nodes. The biggest impact occurs at node 3 (the uppermost model node in Sandy Creek), where the median pmax is −21%. That is, of the reductions in streamflow between the baseline and CRDP from the 347 replicates, the median of the predicted maximum changes is 21%. There is a tightly constrained distribution of pmax values around this median value. At all other model nodes in Sandy Creek (tributary 10) the median reduction in pmax exceeds 9%.
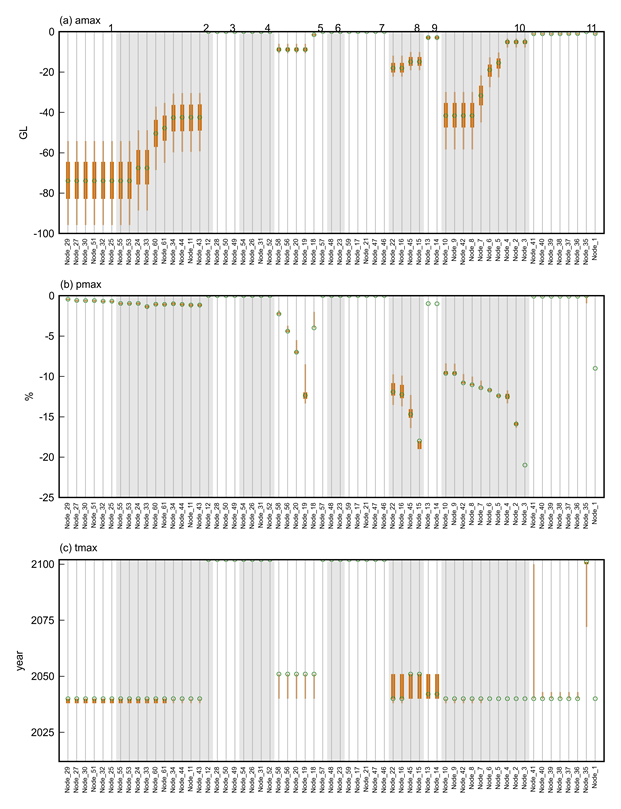
The alternating grey and white shaded zones indicate which surface water model nodes belong to each of the 11 tributaries that comprise the surface water modelling domain in the Galilee subregion. These are numbered at the top of the uppermost figure and are described in more detail in Table 4 and shown in the map on Figure 9. The circle indicates the median prediction, the thick orange vertical line spans the 25th and 75th percentiles and the thin orange vertical line spans the 5th and 95th percentiles.
Data: Bioregional Assessment Programme (Dataset 1)
Elsewhere, there are median reductions of between 12% and 18% in North Creek (tributary 8), up to 12% in Bully Creek (tributary 5) and up to 9% at node 1 which is on a tributary of Native Companion Creek (tributary 11). In the Belyando River (tributary 2) the median impact on pmax is less than 2%, while further downstream in the Suttor River (tributary 1) the median impact is less than 1% and corresponds to a decrease in flow of about 75 ML/day (or 28 GL/year). The additional coal resource development has no impact at all on AF in tributaries 3, 4, 6 and 7.
The maximum changes in AF occur in 2040 at most of the model nodes in tributaries 11, 10, 2 and 1 and there is little uncertainty in these years of maximum change. There is greater uncertainty in tmax at the model nodes in tributaries 9, 8 and 5, where the median tmax values occur between 2040 and 2051.
Nodes 3 and 1 have relatively small catchment areas which both contain parts of the South Galilee Coal Project. The projected changes in pmax at these locations are similar in magnitude to the proportion of their catchment areas that are included in the mine footprint (24% and 10%, respectively, Table 4 in Section 2.6.1.3). The model nodes in tributary 8 are downstream of the proposed Carmichael Coal Mine Project and the China Stone Coal Project, while most of the model nodes in tributary 5 are downstream of the Hyde Park Coal Project.
Among the most heavily impacted model nodes, the largest uncertainties in pmax occur in tributaries 5 and 8 (Carmichael River and North Creek, respectively). The impact on pmax at node 35 (Native Companion Creek) is very small for most replicates, but the 5th percentile change is 4% and the year of maximum change (the median tmax is in 2093) is much later than at other model nodes. This model node is upstream of all coal mines, but does have interaction with the groundwater model, so the only source of flow perturbation is through reductions in baseflow associated with groundwater drawdown.
Interquartile range
Figure 14 shows the changes to the interquartile range (IQR) in AF. As for AF, the largest median pmax values occur in tributaries 10 and 8. The median reductions in IQR vary between 10% and 21% in tributary 10 (Sandy Creek) and between 17% and 19% in tributary 8 (North Creek). Although the median changes in tributaries 2 and 11 are smaller, there is greater uncertainty at some model nodes with some extreme replicates having predicted IQR reductions in excess of 60%.
The median tmax values for IQR are almost all in 2040, though some of the model nodes in tributary 11 (Native Companion Creek) have median tmax values of 2043 and are associated with considerable uncertainty.

The alternating grey and white shaded zones indicate which surface water model nodes belong to each of the 11 tributaries that comprise the surface water modelling domain in the Galilee subregion. These are numbered at the top of the uppermost figure and are described in more detail in Table 4 and shown in the map on Figure 9. The circle indicates the median prediction, the thick orange vertical line spans the 25th and 75th percentiles and the thin orange vertical line spans the 5th and 95th percentiles.
Data: Bioregional Assessment Programme (Dataset 1)
99th percentile
Figure 15 shows the decrease in daily streamflow rate at the 99th percentile (P99) in the 61 model nodes. Again, the biggest median reductions are in tributaries 10 (21% at node 3) and 8 (19% at node 15). However, there are also substantial impacts predicted for nodes 19 and 1 with reductions of 12% and 9%, respectively. The median year of maximum change in P99 remains 2040 in tributaries 10 and 11, but is slightly earlier (2038) in some model nodes in tributaries 1, 2 and 5, and slightly later in tributaries 8 (2042) and 9 (2051).
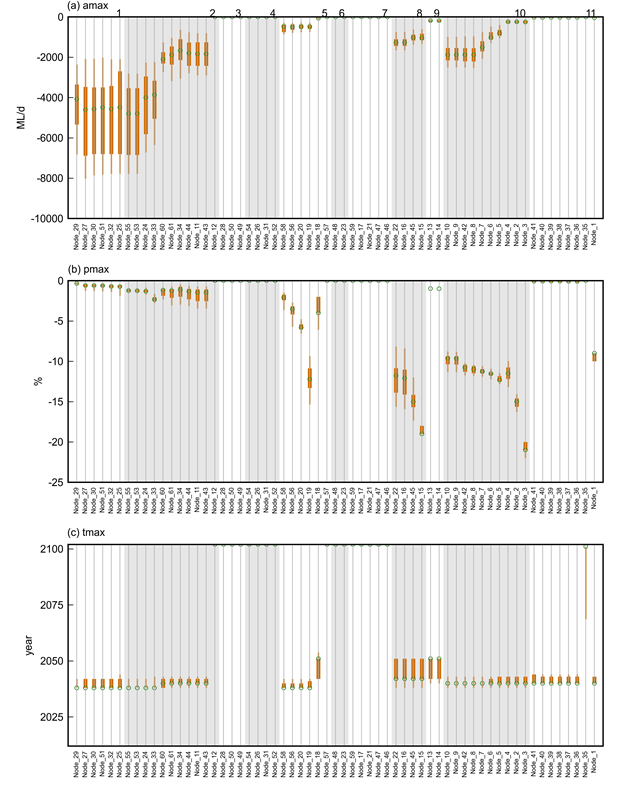
The alternating grey and white shaded zones indicate which surface water model nodes belong to each of the 11 tributaries that comprise the surface water modelling domain in the Galilee subregion. These are numbered at the top of the uppermost figure and are described in more detail in Table 4 and shown in the map on Figure 9. The circle indicates the median prediction, the thick orange vertical line spans the 25th and 75th percentiles and the thin orange vertical line spans the 5th and 95th percentiles.
Data: Bioregional Assessment Programme (Dataset 1)
Flood (high-flow) days
Figure 16 shows the changes to the number of flood (high-flow) days (FD) at the 61 model nodes. There are reductions in median amax of up to 31 days in tributary 10, up to 24 days in tributary 8 and up to 15 days in tributary 11. However, there is much greater uncertainty around changes in the number of high-flow days (and in the timing of the maximum impacts) than there is for changes in annual flow.
The alternating grey and white shaded zones indicate which surface water model nodes belong to each of the 11 tributaries that comprise the surface water modelling domain in the Galilee subregion. These are numbered at the top of the uppermost figure and are described in more detail in Table 4 and shown in the map on Figure 9. The circle indicates the median prediction, the thick orange vertical line spans the 25th and 75th percentiles and the thin orange vertical line spans the 5th and 95th percentiles.
Data: Bioregional Assessment Programme (Dataset 1)
Zero-flow days
The remaining results figures characterise the changes for the low-streamflow hydrological response variables. Figure 17 shows the changes to the number of zero-flow days (ZFD) at the 61 model nodes. The biggest changes are in the lower parts of the Belyando River (tributaries 1 and 2) where the median number of ZFD increase by more than 75 days per year in the reaches between nodes 34 and 32. The increases exceed 65 days further downstream in the Suttor River (tributary 1). Elsewhere, there are predicted median increases in ZFD of up to 16 days in Native Companion Creek (tributary 11) with the increases getting larger with distance downstream. In all model nodes with substantial increases in ZFD, there is considerable uncertainty in the amax values.
The increases in ZFD in tributaries 1, 2 and 11 tend to occur relatively late in the simulation period, with median predicted tmax values occurring later than 2080. In other model nodes with less substantial increases in ZFD, the median year of maximum change is earlier and occurs between 2030 and 2050.

The alternating grey and white shaded zones indicate which surface water model nodes belong to each of the 11 tributaries that comprise the surface water modelling domain in the Galilee subregion. These are numbered at the top of the uppermost figure and are described in more detail in Table 4 and shown in the map on Figure 9. The circle indicates the median prediction, the thick orange vertical line spans the 25th and 75th percentiles and the thin orange vertical line spans the 5th and 95th percentiles.
Data: Bioregional Assessment Programme (Dataset 1)
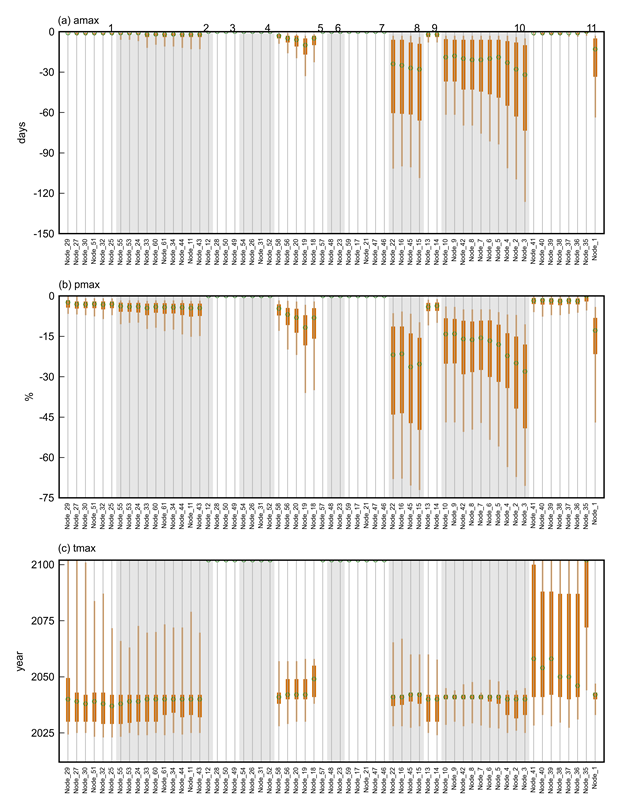
Low-flow days
Figure 18 shows the predicted changes to low-flow days (LFD), the number of days per year the flow is less than the long-term 10th percentile, at 61 model nodes. As for ZFD, the largest changes in the frequency of LFD occur in tributaries 1 and 2, where median increases in the predicted maximum annual difference between the two development pathways are between 100 and 200 days. Increases of LFD of more than 40 days per year are predicted for some model nodes in Sandy Creek and Native Companion Creek (tributaries 10 and 11, respectively).
Years of maximum change in LFD reflect those for ZFD, with later median tmax values being predicted for tributaries 1, 2 and 11 contrasting with earlier tmax values for model nodes in tributaries 8 and 10.
The alternating grey and white shaded zones indicate which surface water model nodes belong to each of the 11 tributaries that comprise the surface water modelling domain in the Galilee subregion. These are numbered at the top of the uppermost figure and are described in more detail in Table 4 and shown in the map on Figure 9. The circle indicates the median prediction, the thick orange vertical line spans the 25th and 75th percentiles and the thin orange vertical line spans the 5th and 95th percentiles.
Data: Bioregional Assessment Programme (Dataset 1)
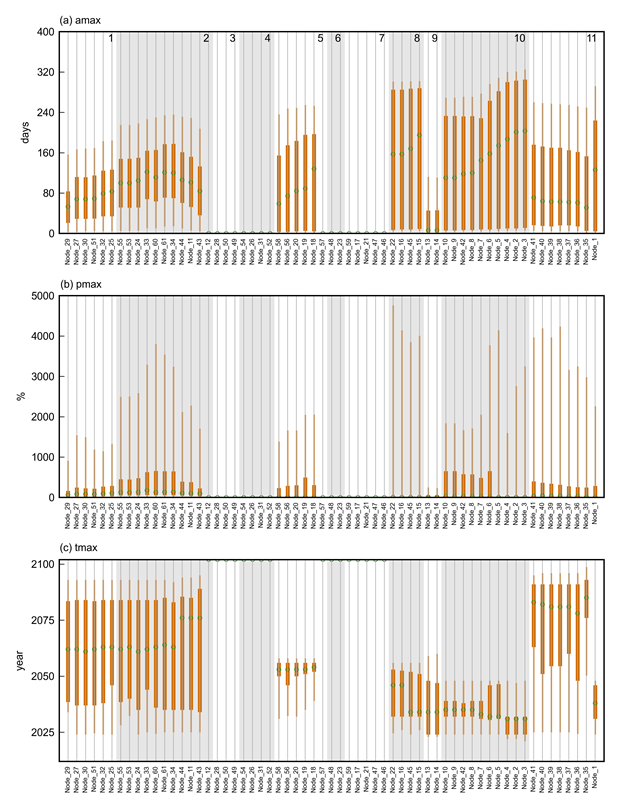
Low-flow spells
Figure 19 shows the changes to the number of low-flow spells (LFS) at the 61 model nodes. The maximum annual number of LFS across the modelling domain is simulated to increase by a median of up to 10 events. Median maximum increases of more than five events per year are predicted for some model nodes in tributaries 1, 2, 5 and 10, with smaller median increases in tributaries 8, 9 and 11. Maximum changes in LFS are likely to occur before 2050 in all parts of the subregion, except tributary 11, where median tmax values of between 2061 and 2075 are predicted.
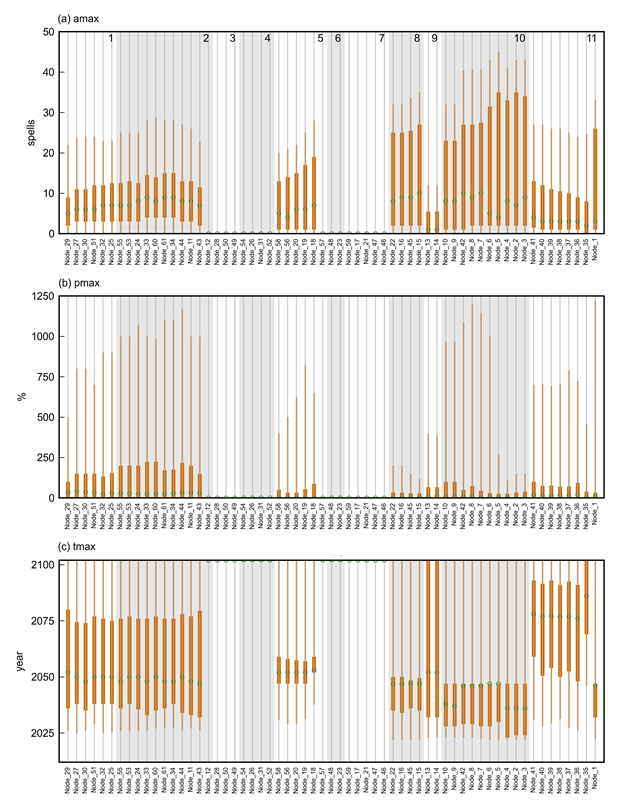
The alternating grey and white shaded zones indicate which surface water model nodes belong to each of the 11 tributaries that comprise the surface water modelling domain in the Galilee subregion. These are numbered at the top of the uppermost figure and are described in more detail in Table 4 and shown in the map on Figure 9. The circle indicates the median prediction, the thick orange vertical line spans the 25th and 75th percentiles and the thin orange vertical line spans the 5th and 95th percentiles.
Data: Bioregional Assessment Programme (Dataset 1)
Longest low-flow spell
Figure 20 shows the maximum changes to the length of the longest low-flow spell (LLFS) at the 61 model nodes. The longest low-flow spell is projected to increase in length by about 70 days between nodes 34 and 33 in the Belyando River (tributary 2). Other substantial increases in LLFS (by more than 20 days) are predicted for tributaries 1, 8, 10 and 11. The large changes in LLFS are likely to occur between 2065 and 2081 in tributaries 1, 2 and 11, but between 2032 and 2043 in tributaries 8 and 10.

The alternating grey and white shaded zones indicate which surface water model nodes belong to each of the 11 tributaries that comprise the surface water modelling domain in the Galilee subregion. These are numbered at the top of the uppermost figure and are described in more detail in Table 4 and shown in the map on Figure 9. The circle indicates the median prediction, the thick orange vertical line spans the 25th and 75th percentiles and the thin orange vertical line spans the 5th and 95th percentiles.
Data: Bioregional Assessment Programme (Dataset 1)
