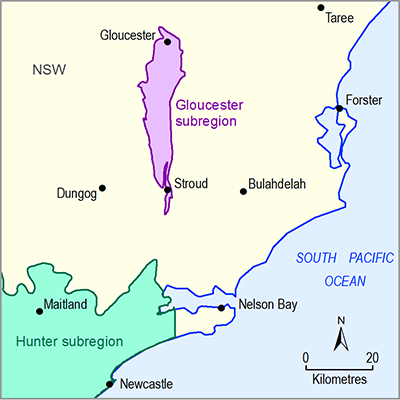
The Gloucester subregion contains rivers flowing in two separate river basins, the Gloucester river basin and the Karuah river basin (Figure 3). The Gloucester River, a major tributary of the Manning River, flows through the northern part of the subregion. The main tributaries of the Gloucester River are the Avon, Barrington and Bowman rivers. The main river flowing through the southern part of the subregion is the Karuah River whose main tributaries include the Mammy Johnsons, Telegherry and Branch rivers. Further detail for these rivers and their tributaries can be found in the context statement (see companion product 1.1 for the Gloucester subregion (McVicar et al., 2014)). The water accounts for these river basins are described in the following sections.
1.5.1.1.1 Water accounts in the Gloucester river basin
The surface water resources in the Gloucester river basin are not regulated rivers in the sense that they do not host major dams or weirs, but are affected by irrigation diversion (Reinfelds et al., 2015). There are about 329 ha and 282 ha, respectively, of irrigation occurring upstream of the streamflow gauging sites on the Barrington River at Relfs Road (gauge ID: 208031) and on the Gloucester River downstream from Gloucester (gauge ID: 208003). The Avon and Bowman rivers are also strongly affected by irrigation extraction with about 190 ha and 104 ha of irrigated land, respectively (Reinfelds et al., 2015).
The Gloucester River produces mean annual flow of 84 GL/year at the upper stream gauge (208020), but mean annual flow of 550 GL/year at its lower stream gauge (208003), more than 70% of which is contributed by the Barrington River (Table 3).
Table 3 Mean annual flow for major rivers in the Gloucester river basin in the Gloucester subregion
Data: NSW Office of Water (Dataset 1)
Under NSW government water sharing plans (DPI, 2009), there are 84 surface water access licences amounting to 6806 ML/year of water for the stream network within the northern part of Gloucester river basin (Table 4). This is about 1.64% mean annual flow produced by the Gloucester river basin (gauge ID: 208003). It is noted that these are licenses for extraction but do not necessarily represent the actual diversions for water extraction.
Table 4 Surface water access licences in the Gloucester river basin in the Gloucester subregion
|
Name of river |
Number of licences |
Entitlements (ML) |
|---|---|---|
|
Avon River |
35 |
1690 |
|
Barrington River/Lower Gloucester River |
9 |
1555 |
|
Upper Gloucester River |
40 |
3561 |
Data: Bioregional Assessment Programme (Dataset 2)
1.5.1.1.2 Water accounts in the Karuah river basin
The surface water resources in the Karuah river basin are not subject to regulation by major dams or weirs. The Karuah River produces a mean annual flow of 270 GL/year at Booral (gauge ID: 209003) (Table 5).
Table 5 Mean annual flow for major rivers in the Karuah river basin in the Gloucester subregion
|
Name of river |
Mean annual flow (GL) |
Average years |
Stream gauge ID |
|---|---|---|---|
|
Karuah River |
270 |
1968–2003 |
209003 |
|
Mammy Johnsons River |
59 |
1967–2013 |
209002 |
Data: NSW Office of Water (Dataset 1)
For the Karuah River flowing through the southern part of the subregion, there are 25 nominal entitlements granted as ‘water access right’ amounting to 951 ML/year of water for the stream network (Table 6). This is about 6.5% of the mean annual flow produced by the Karuah river basin (gauge ID: 290003). It is noted that these are entitlements for extraction but may not necessarily represent the actual diversions.
Table 6 Surface water access licenses in the Karuah river basin in the Gloucester subregion
|
Name of river |
Number of licences |
Entitlements (ML) |
|---|---|---|
|
Karuah River |
25 |
951 |
Data: Bioregional Assessment Programme (Dataset 2)
1.5.1.1.3 Gaps
There is a lack of long-term streamflow observation at some gauges, leading to a high degree of uncertainty in understanding variability of annual streamflow. There is little information on how much surface water is actually used by the nominal entitlements.


