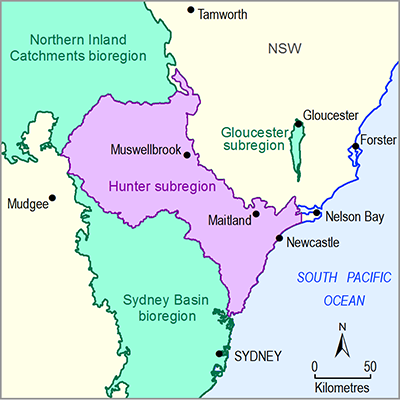
The Hunter river basin includes a large proportion of salt bearing sedimentary rocks and soils, and surface and underground drainage from this contributes natural salinity to the river. But activities such as coal mining, power generation, industry and land clearing have increased the level of salinity in the river.
In 1995, in response to the need to control saline water discharges into the Hunter River, the NSW Office of Water and the Environment Protection Authority, together with other interested organisations, developed the Hunter River Salinity Trading Scheme (HRSTS), an innovative method which reduces saline levels in the river while allowing mines and industry to discharge their excess water during periods of high flow thus maintaining stream water quality. The HRSTS has two major objectives: (i) to minimise the impact of saline water discharges on irrigation and other water uses, and on the aquatic environment of the Hunter River catchment; and (ii) to reduce pollution through saline water discharges at the least overall cost to the community.
The central idea of the HRSTS is to only discharge salty water during flood events. When the river is in low flow, no discharge is allowed; when the river is in high flow, limited discharge is allowed; when the river is in flood, unlimited discharge is allowed. The river is divided into blocks. For each block, scheme operators continually monitor the flow level and the ambient salinity and calculate how much salt can be added to the block. There are a total of 1000 salt discharge credits in the HRSTS. Different licence holders have different numbers of credits, which allow them to discharge salt into a river block in proportion to the credits they hold. Credits can be traded among licence holders. This gives each licence holder the flexibility to increase or decrease their allowable discharge from time to time.
The HRSTS was designed to suit the unique characteristics of the Hunter River catchment. The successful execution of the scheme depends on (i) rigorous data and modelling, (ii) a community prepared to work together and try new ideas, (iii) a focus on environmental outcomes (and a break with tradition), (iv) underpinning by legislation and (v) real time data and trading.
Before the HRSTS was introduced in 1995 there was significant conflict between primary producers and mining operators. Discharges from industry increased salt in the river at times making the water unsuitable for irrigation (Figure 39, Figure 40 and Figure 41). Note that the data used for Figure 39, Figure 40, Figure 41, Figure 42, Figure 43 and Figure 44 were provided by the Bureau of Meteorology. This was particularly evident at Glennies Creek on the Hunter River where the maximum electrical conductivity (EC) was about 2650 µS/cm in April 1994. This is much more than its salinity target of 900 µS/cm. Note that the EC of drinking water usually varies between 600 µS/cm and 1200 µS/cm.
The salinity of the Hunter River has been well controlled since the introduction of the HRSTS. Since 1995, EC has varied, the majority of time, from 300 µS/cm to 900 µS/cm for the three major salinity control sites – Denman (Figure 39), Glennies Creek (Figure 40) and Singleton (Figure 41) – on the Hunter River. River salinity has been mostly below the salinity target of 900 µS/cm at Glennies Creek and Singleton. However, river salinity at Denman has only sometimes met the salinity target of 600 µS/cm. Since 2007, there have been a significant number of days with an EC value more than 800 µS/cm.
The red line shows the salinity target of 600 µS/cm.
The NSW Office of Water undertook water quality sampling at three sites on the Hunter River from October 2006 to December 2006, a period of extreme low flow conditions (NSW Office of Water, 2011). Nutrient concentrations during these low streamflow conditions were found reasonable, relatively consistent with median Hunter River values (Total Nitrogen 0.35 mg/L and Soluble Phosphorus 0.005 mg/L). The assessed river turbidity levels were found to be above the long-term median values for the three sites.
The red line shows the salinity target of 900 µS/cm.
The red line shows the salinity target of 900 µS/cm.


