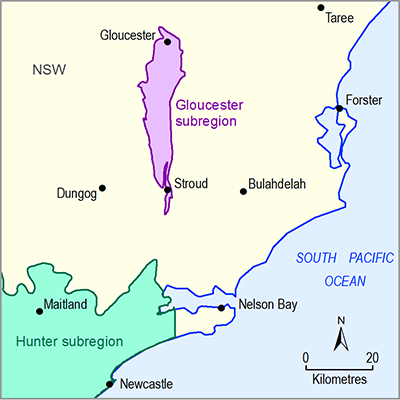
Groundwater monitoring undertaken by Parsons Brinckerhoff (2012a; 2012c; 2013b) within the Gloucester Basin provides some evidence for a topographical groundwater flow divide in the middle of the basin north of Wards River, approximately coincident with the surface water divide (Figure 25). This separates the Gloucester Basin into a northern sub-basin (where regional groundwater flow is predominantly from south to north) and a southern sub-basin (where regional groundwater flow is predominantly from north to south). The groundwater level (or heads) appears to be at less than 140 metres Australian Height Datum (mAHD) at the divide (60 to 160 mbgl), less than 60 mAHD at the outflow in the south and less than 100 mAHD at the outflow in the north – both outflows are practically at the surface elevation (see Figure 5.9 in Parsons Brinckerhoff, 2013b, p. 40). Based on limited observation data it appears that locally, groundwater flow can be east to west or west to east as groundwater may flow laterally from rock outcrop areas towards the centre of the basin.
Due to greater transmissivity of alluvial deposits, the greater rates of groundwater fluxes (and lesser residence time) are more likely to be associated with alluvial aquifers than in the underlying Permian deposits. This also is supported by groundwater age dating (Parsons Brinckerhoff, 2012a).
As the Gloucester Basin appears to be a closed system, groundwater recharge and discharge is confined to the syncline structure. Recharge associated with rainfall occurs at the outcropping aquifers, including the alluvial sediments along the valley floor, and shallow Permian fractured aquifers and deeper water-bearing zones (e.g. coal seams) around the flanks of the Gloucester Basin. It is not ruled out that upward fluxes can also occur through vertical leakage or faulting from deeper to shallower layers. Based on preliminary numerical modelling, vertical fluxes between hydrogeological units are generally low with a relatively higher upward flux from the fractured rock aquifer to the alluvial aquifer (Parsons Brinckerhoff, 2013c). However, there is no consistency in the groundwater level monitoring data in nested bores in terms of differences in the hydraulic heads and groundwater levels, as both upward and downward trends were reported (Parsons Brinckerhoff, 2012c).
Groundwater recharge was estimated as zero to 17% (under steady state conditions) and zero to 28% (under transient conditions) of rainfall on average with high values associated with alluvial aquifers (Australasian Groundwater and Environmental, 2013; Heritage Computing, 2009; 2012; Parsons Brinckerhoff, 2013c). It was also reported that rainfall in excess of 80 mm in a week and associated significant stream flow events greater than 3000 ML/day are required to recharge the alluvial groundwater system and sustain baseflow over the following months. Parsons Brinckerhoff (2013c) concluded that the alluvial system has limited storage and is rapidly depleted and replenished in response to rainfall variations.
Discharge occurs from all the hydrogeological units to rivers and streams (localised discharge) and, as evapotranspiration by deep-rooted vegetation, from the shallow watertable (diffuse discharge). Some limited groundwater outflow is likely along the most northern and southern edges of the Gloucester Basin. The elements of the basin water balance were estimated by Parsons Brinckerhoff (2013c) as 9.5 GL/year baseflow (or 2.9% rainfall), 0.2 GL/year seepage along the northern and southern boundaries (or 0.06% rainfall) and 1.7 GL/year diffuse discharge from the shallow watertable (or 0.5% rainfall on average).
A summary of the water balance estimation, based on groundwater modelling, is given in Table 5 for Duralie (see Tables B-7 (pp. B-25) and B-12 (pp. B-30) in Heritage Computing, 2009) and Stratford (see Table A-16 (pp. A-45) in Heritage Computing, 2012) coal mine and for the Rocky Hill Coal Project (see Table 18 (pp. 4-102) in Australasian Groundwater and Environmental, 2013). The locations of these mines are shown in Figure 25.The values of the water balance elements are site specific. A detailed numerical model is required to estimate reliable water balance values for the entire Gloucester Basin and to assess the cumulative impact of all proposed developments.
Table 5 Water balance estimation
Source data: 1Tables B-7 and B-12 in Heritage Computing (2009), 2Table A-16 in Heritage Computing (2012), 3Table 18 in AGE (2013)

