Breadcrumb
Figure 12 shows a small decrease in the P99 at all 16 model nodes. The 95th percentile of change in P99 does not exceed 0.35 ML/day. The median values of percentage change are all less than 0.001%. The median year of maximum change in the catchments with non-zero median absolute changes is close to 2050.
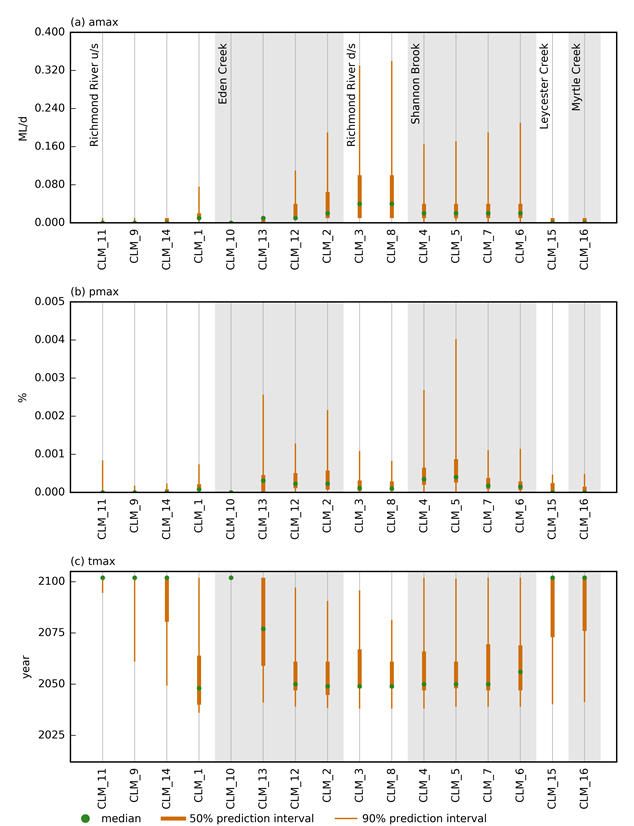
d/s = downstream of; u/s = upstream of
The circle indicates the median of the posterior predictive distribution, the length of the thick vertical line spans the interquartile range (or 50th percentile prediction interval), and the thin vertical line spans the 90th percentile prediction interval. Nodes are grouped per catchment, ordered from upstream to downstream.
Data: Bioregional Assessment Programme (Dataset 2)
Last updated:
18 October 2018

Summary and download
Product Finalisation date
2016
PRODUCT CONTENTS
ASSESSMENT
ASSESSMENT COMPONENT