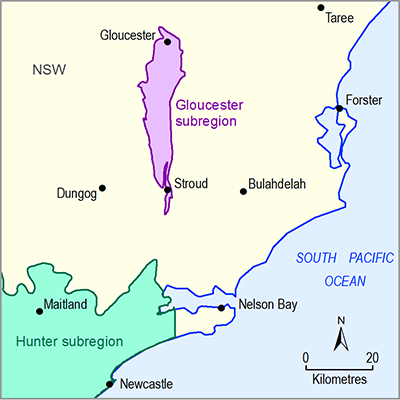
Section 2.6.1.6 summarises the prediction results for 30 surface hydrological receptors (see Table 4) and the eight hydrological response variables:
- P01 – the daily streamflow rate at the first percentile (ML/day)
- LFD – the number of low-flow days per year. The threshold for low-flow days is the 10th percentile from the simulated 90-year period (2013 to 2102)
- LFS – the number of low-flow spells per year (perennial streams only). A spell is defined as a period of contiguous days of streamflow below the 10th percentile threshold
- LLFS – the length (days) of the longest low-flow spell each year
- P99 – the daily streamflow rate at the 99th percentile (ML/day)
- FD – flood days, the number of days with streamflow greater than the 90th percentile from the simulated 90-year period (2013 to 2102)
- AF – the annual flow volume (GL/year)
- IQR – the interquartile range in daily streamflow (ML/day). That is, the difference between the daily streamflow rate at the 75th percentile and at the 25th percentile.
A ninth hydrological response variable defined in companion submethodology M06 (as listed in Table 1) for surface water modelling (Viney, 2016) – the annual number of zero-flow days (ZFD) – is not reported here because most of the streams in the Gloucester subregion are perennial (see Section 2.6.1.4).
For each of these hydrological response variables a time series of annual values is constructed.
For each receptor, 10,000 sets of randomly selected parameter values were used to generate 10,000 replicates of development impact. From these, the best 1000 replicates for each hydrological response variable, as assessed by their ability to predict that hydrological response variable at the four observation sites, were chosen for further analysis. Each boxplot was generated from the resulting 1000 samples. The boxplots show the distributions over the 1000 replicates of the maximum raw change (amax) in each metric between the baseline and CRDP predictions, the corresponding maximum percent change (pmax) and the year of maximum change (tmax). In general, the most meaningful diagnostic for the flux-based metrics (P01, P99, AF and IQR) will be pmax, while the most meaningful diagnostic for the frequency-based metrics (LFD, LFS, LLFS and FD) will be amax.

