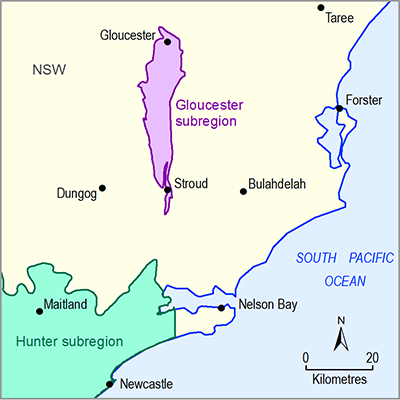
Several open-cut coal mines are active or planned in the Gloucester subregion (Figure 14). For each, mine-pit footprints are digitised of the historical position of the main excavation, the approved extensions and the proposed new developments. Figure 15 summarises the water extraction for each pit from a mixture of measured rates (for the historical pumping rates), and modelled, expected pumping rates (baseline coal resource development (baseline) and CRDP), based on environmental impact assessment reports (see companion product 1.2 for the Gloucester subregion (Hodgkinson et al., 2014)). Note that the mine footprints are entirely contained within the surface weathered and fractured rock layer, that is, none of the mine footprints extends into the alluvium.
The pumping rate time series is assigned to the mine footprint polygon in the regional analytic element groundwater model (GW AEM) in the surface weathered and fractured rock layer as a Neumann boundary condition, that is, a specified flux boundary condition that varies in time (Franke et al., 1987). The historical pumping rates are identical in both the baseline and CRDP runs. The future (i.e. post 2012) pumping rates in the CRDP run are the pumping rates for the new-to-be-developed mines (Rocky Hill Coal Project, Avon North Open Cut and Stratford East Open Cut) or mines that are planned to be extended (Duralie Coal Mine, Stratford Roseville West Pit Extension). The mines that will be extended have the CRDP pumping rate assigned to the combined baseline and CRDP polygon (Figure 14). Only the combined pumping rate of the existing and extension of the mine are available. The combined pumping rate is assigned to the mine polygon in the CRDP. The pumping rate for the baseline run is the combined pumping rate multiplied by the ratio of area of the existing mine over the area of the extended mine.
ACRD = additional coal resource development
Data: Bioregional Assessment Programme (Dataset 1)
Data: Bioregional Assessment Programme (Dataset 1)

Product Finalisation date
- 2.6.2.1 Methods
- 2.6.2.2 Review of existing models
- 2.6.2.3 Model development
- 2.6.2.4 Boundary and initial conditions
- 2.6.2.5 Implementation of coal resource development pathway
- 2.6.2.6 Parameterisation
- 2.6.2.7 Observations and predictions
- 2.6.2.8 Uncertainty analysis
- 2.6.2.9 Limitations and conclusions
- Citation
- Acknowledgements
- Currency of scientific results
- Contributors to the Technical Programme
- About this technical product


